Malware analysis and Malicious process identification is a major and important aspect of digital forensic analysis. It is necessary to analyze the Random Access Memory (RAM) along with the storage disks (Secondary Storage) for evidence. It helps to identify the processes and activities which were active during the certain time period.
In this article, let’s see how to analyze RAM using Volatility Framework
Volatility Framework
Volatility Framework provides open collection of tools implemented in Python for the extraction of digital artifacts from volatile memory (RAM) samples. It is the world’s most widely used memory forensics platform for digital investigations. It supports memory dumps from all major 32- and 64-bit Windows, Linux and Mac operating systems. Check github page for further details.
Memory Dump Acquisition
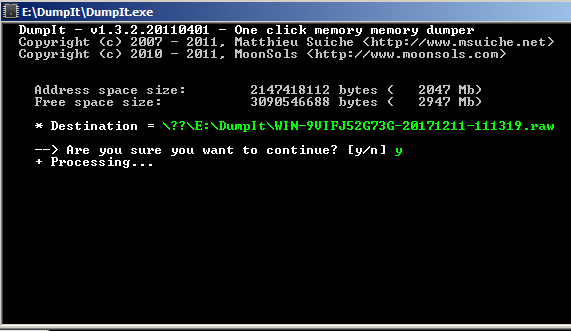
Memory dump acquisition is the first step in Memory analysis. Use tools like dumpit for windows and dd command for Linux operating system to get memory dump. dumpit is utility to generate physical dump of windows machine, works for both x86 (32-bits) and x64 (64-bits) machines.
Usually, a memory dump size is same as that of the size of RAM. For an example Windows XP SP2 machine with a volatile memory of 512 MB would have memory dump 512 MB size.
After getting the memory dump a hash values should be checked. To do so sha256sum can be used. There exists hash calculating tools such as md5sum, sha1sum. But as both of these things are broken by now it is much safer and acceptable under the court of law if a tool based on SHA256 is used. However, these sum tools are specific for Linux. For Windows-based systems, there exists a number of tools. But hashcalc would be a better and an obvious choice considering it’s simplicity.
Memory Dump Analysis
For the analysis of the acquired memory dump, Volatility Framework can be used. Volatility is a python based framework which can be used on different operating systems for memory analysis. You can download volatility using its GitHub repository. There are a number of things that can be analyzed via volatility framework. We will be discussing them late in this blog.
Methodology
Windows
Initially, run dumpit.exe within the operating system (If it is windows).

Linux
use dd command for memory acquisition from /dev/mem of /dev/fmem. Here root privileges would be required.
dd if=/dev/mem or /dev/fmem of=/outputFile bs=64K conv=noerror,sync

You can find some interesting facts about types of memories that can be acquired in Linux systems by [5].
After getting the memory images (dd/raw), get the hash values of these images to check the integrity and to confirm that nothing has changed in the image.
After getting the disk image and getting the hash values, we can directly move to the analysis procedure.This is the instance where the role of Volatility comes in to play.
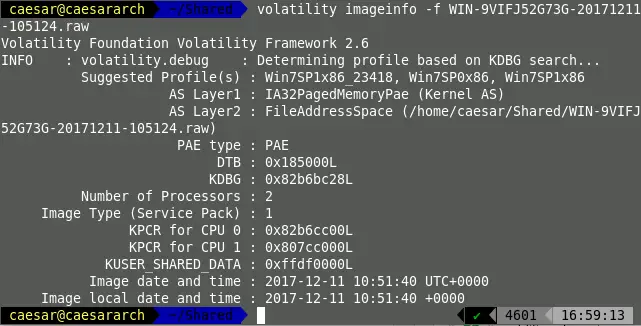
Initially, run volatility with the attribute imageinfo in order to find about the available information in the memory image.
python volatility.py imageinfo -f <memory_image_to_be_analyzed>

With the use of volatility.exe, the memory image can be acquired as,
volatility.exe imageinfo -f <memory_image_to_be_analyzed>
After getting the analyzed details,details such as possible OS profiles, number of Processors in the given system, etc. can be derived.
In most of the cases volatility suggests multiple profiles with the volatility framework. In order to select the best memory profile for further analysis a kdbgscan is used. Here by removing dummy profiles in which the number of processes and number of modules become a non-realistic value (0) the correct profile can be selected.
For demonstration purpose I have used a profile named WinXPSP2 here.
python volatility.py -f <memory_image> --profile=WinXPSP2 kdbgscan
After selecting the correct profile it can be moved in to the next steps of analysis.
Bu using the following command, a list of processes can be obtained which were there within the memory.
python volatility.py --profile=WinXPSP2 pslist -f <memory_image>


A parent-child relationship in between the processes can be obtained using the pstree attribute.
python volatility.py --profile=WinXPSP2 pstree -f <memory_image>
There exists a number of optional attributes that can be used to specify various details [1].
A list of network connections can be recovered via ,
python volatility.py netscan -f <memory_image> --profile=WinXPSP2


Except for these direct information retrieval, there exists a number of mechanisms in which data can be retrieved (Malware dumps) and analyzed.
The command history too can be scanned by using the cmdhistory attribute.
Then how to detect malicious files
In volatility, there exists an attribute named malfind. This is actually an inbuilt plugin and can be used for malicious process detection.
python volatility.py malfind -D <Output_Location> -p <PID> -f <memory_image> --profile=WinXPSP2
If the above command doesn’t generate a result then it can be defined as non-malicious. However, if detailed memory analysis is found it can be classified as a malicious process.

References
- https://github.com/volatilityfoundation/volatility
- http://www.slavasoft.com/hashcalc/
- http://qpdownload.com/dumpit/
- https://www.gnu.org/software/coreutils/manual/html_node/dd-invocation.html
- https://unix.stackexchange.com/questions/119762/how-to-dump-memory-image-from-linux-system
